




















POS Reports: The Sales Numbers and KPIs Every Owner Should Check
The daily, weekly and monthly POS reports worth your time, how to calculate average ticket and margins, and what to do when a number moves.
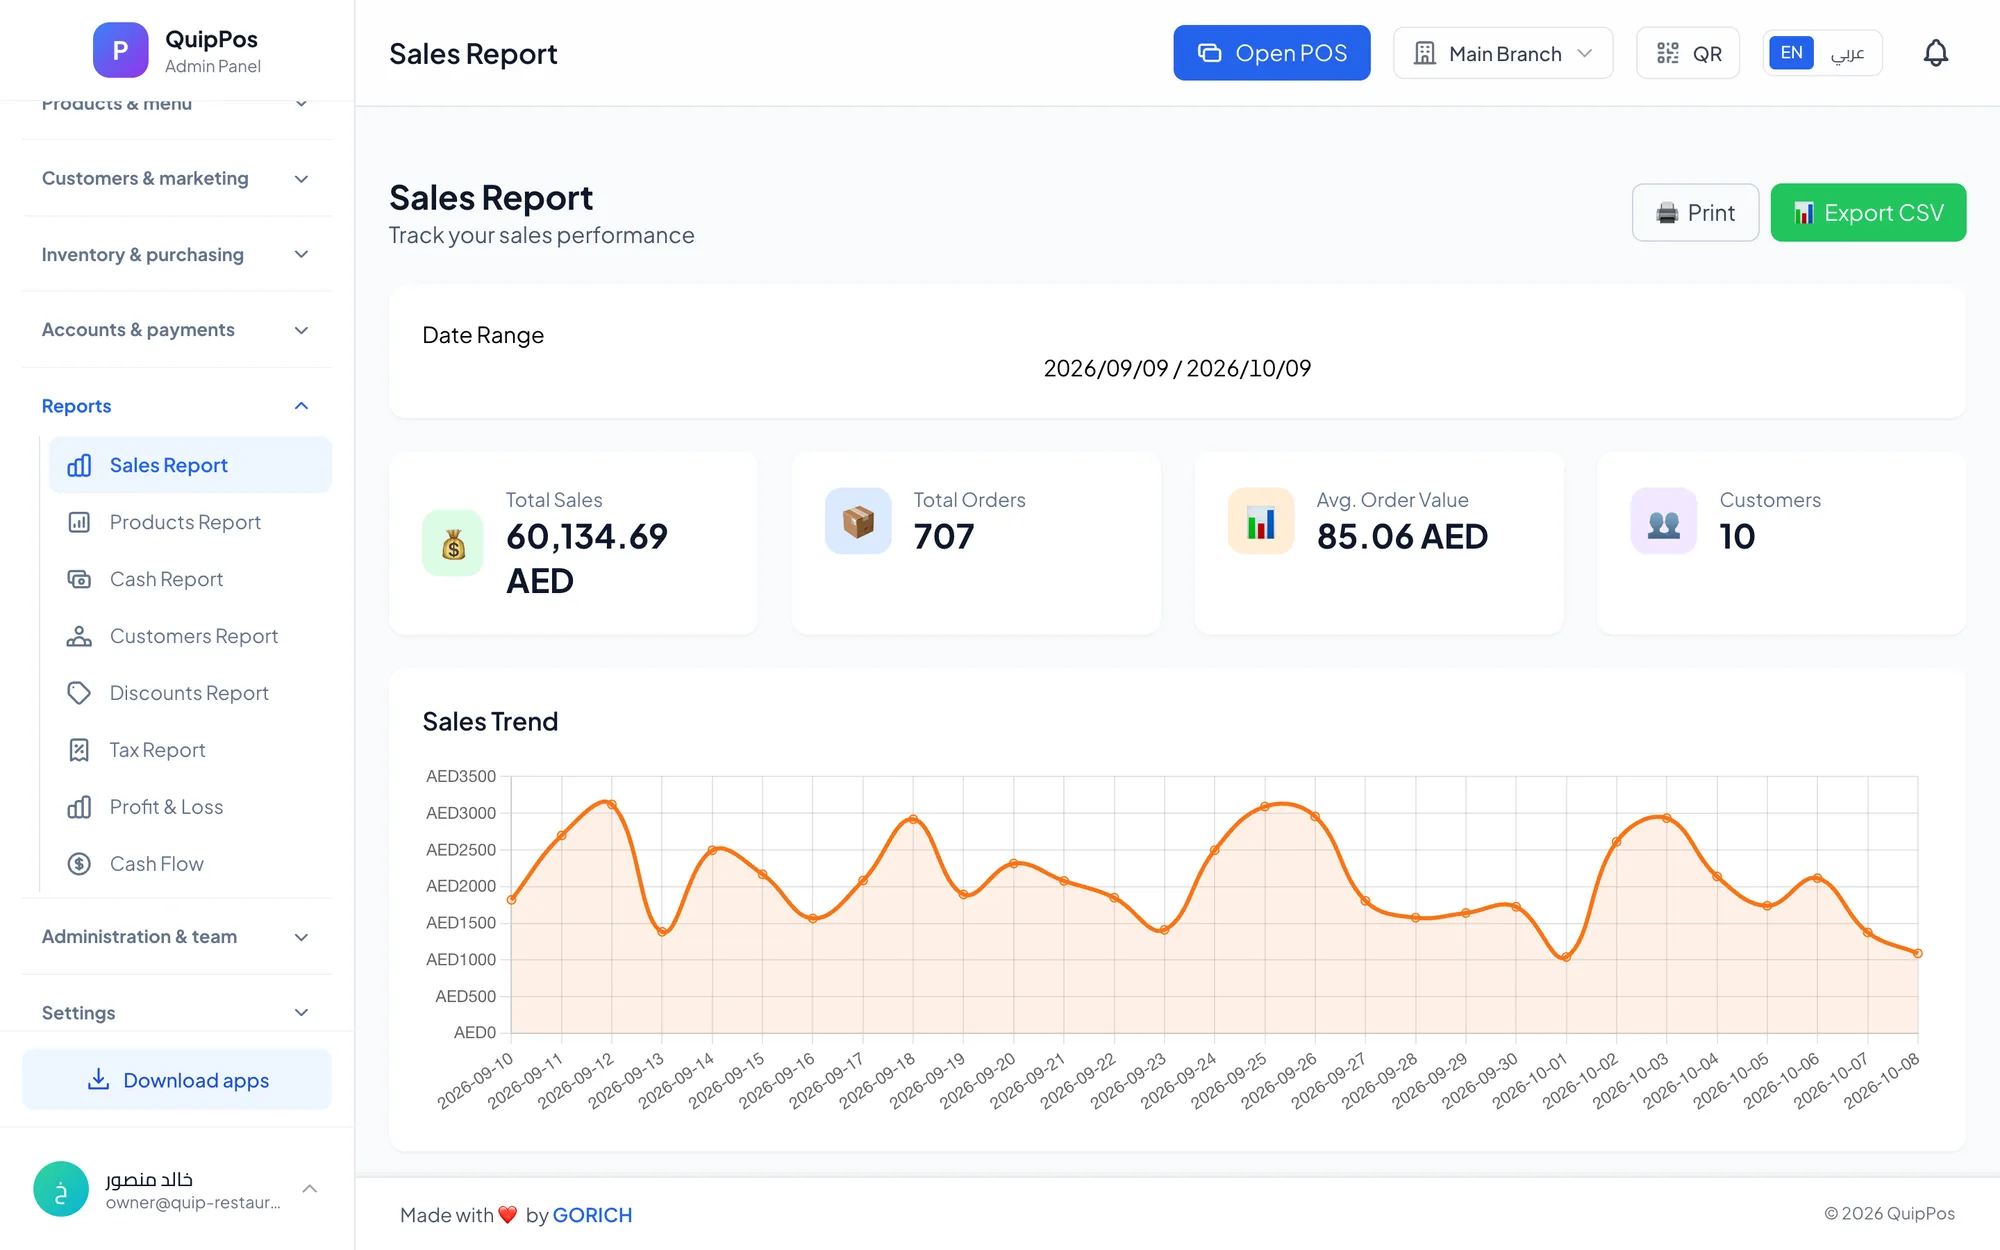
The POS reports every owner should check are daily sales (paid and unpaid), the number of orders and average ticket, best sellers, discounts and refunds, and the cash count for each shift. Weekly, review product and customer trends; monthly, review cash flow, tax and profit and loss. Each number should lead to one clear decision.
Modern point of sale software produces dozens of reports. Many owners open none of them, or open all of them and act on nothing. The fix is a short list of numbers you check at a fixed time, with a rule for what you do when each one moves.
This guide gives you that list, the formulas behind the key business KPIs, worked examples and a weekly routine that takes about 20 minutes.
- Check five numbers daily: sales, unpaid balance, order count, discounts and refunds, and cash over/short.
- Average ticket = net sales ÷ number of orders, and it is often easier to raise than footfall.
- Rank products by margin, not only by quantity sold.
- Measure every promotion against what it cost you in discounts.
- Review profit and loss monthly, with expenses, not just sales.
Which POS reports should a business owner check?
You do not need every report every day. Match each report to a rhythm and a trigger for action.
| Report | What it tells you | How often | Act when |
|---|---|---|---|
| Sales summary | Revenue, paid and unpaid | Daily | Sales fall against the same day last week |
| Cash and shift report | Expected vs counted cash | Every shift | Any shortage beyond small change |
| Product report | Best sellers and slow movers | Weekly | A key item slows down or runs out |
| Discount report | Value given away, by code | Weekly | Discounts grow faster than sales |
| Customer report | Repeat buyers and balances | Weekly | Unpaid balances keep growing |
| Tax report | Tax collected on sales | Monthly | Before every filing |
| Cash flow | Money in and out | Monthly | Outflows exceed inflows |
| Profit and loss | Real profit after costs | Monthly | Net margin falls |
The daily check: five numbers to review before you close
Spend five minutes at the end of each day on these numbers. If all five look normal, close the report. If one does not, open the detail behind it.
- Net sales: compare with the same weekday last week, not with yesterday. A Friday in Dubai and a Monday are different businesses.
- Paid vs unpaid: laundries and repair centres often collect payment at pickup, so know how much money is still outside.
- Number of orders: tells you whether a change in sales came from fewer customers or smaller baskets.
- Discounts, refunds and voids: a sudden rise means either a promotion is working or a problem is starting.
- Cash over/short per shift: small differences happen; a repeated pattern does not happen by chance. Our guide to cash and shift management explains how to close cleanly.
How do you calculate average ticket and raise it?
Average ticket, also called average transaction value or average order value, is net sales divided by the number of orders. It is one of the most useful business KPIs because it separates how many customers came from how much each one spent.
Example: a café in Abu Dhabi sells AED 6,300 on a Saturday from 350 orders, an average ticket of AED 18. If the team adds a AED 12 pastry to one order in ten, sales rise by AED 420 and the average ticket reaches AED 19.20, without a single extra customer.
Practical ways to raise average ticket
- Suggest one add-on per category: a pastry with coffee, a screen protector with a phone, a treatment with a haircut.
- Create bundles priced slightly below the sum of their parts.
- Place high-margin items first in their category on the POS screen.
- Use loyalty points to reward a slightly bigger basket, not only a return visit.
Watch the order count at the same time. A higher average ticket with fewer orders may mean you have priced some customers out.
Product reports: best sellers, slow movers and margins
The best-seller list tells you what customers want. It does not tell you what makes you money. A dish that sells 80 times a day at a 20% margin can earn less than one that sells 30 times at 60%.
Each week, sort your products into three groups:
- Stars: high sales and a healthy margin. Keep them visible and never let them run out.
- Workhorses: high sales, thin margin. Review the cost or adjust the price slightly.
- Slow movers: low sales. Promote, bundle or remove them to free shelf space and cash.
For restaurants, margin depends on accurate recipe costs; our guide to recipe costing and food cost control shows how to work it out. For shops, compare slow movers with stock on hand. A phone case that sells twice a month with 200 units in the warehouse is cash sitting on a shelf.
Discount reports: are your promotions paying off?
Discounts are the easiest way to lose margin without noticing. The discount report shows how much you gave away and through which promo codes, so you can judge each offer on facts.
Ask three questions about every promotion. Did sales or order count rise during the offer compared with a normal week? Did the discount cost less than the extra gross profit it brought in? Did customers come back after the offer ended? If a 20% code mostly went to customers who would have paid full price, it cost you money.
Compare manual discounts across employees and shifts too. One cashier giving far more discounts than colleagues deserves a closer look, and our guide on reducing employee theft at the POS explains what to check.
What the customer report adds
A discount is only worth it if it brings people back. The customer report shows who buys, how often and what they owe. Look for three things each week: how many sales came from returning customers, which regulars have not visited for a while, and which balances are overdue. A perfume shop in Riyadh that notices a regular has not bought in two months can send a friendly message before that customer drifts to a competitor.
Cash flow, tax and profit and loss: the monthly view
Sales show activity; profit shows health. Once a month, look beyond the till.
Cash flow
Cash flow tracks money coming in, such as collected sales and paid receivables, and money going out, such as supplier payments, rent, salaries and expenses. A business can be profitable on paper and still run short of cash if customers pay late or stock is bought too early. Watch customer balances and supplier balances side by side.
Tax
The tax report shows how much tax you collected on sales over the period. Reconcile it with each filing, and check your local rules or ask your accountant how it must be reported.
Profit and loss
Net sales minus the cost of goods sold gives gross profit. Gross profit minus operating expenses gives net profit. Example: a salon in Doha with QAR 80,000 in monthly net sales, QAR 12,000 in product costs and QAR 50,000 in rent, salaries, commissions and other expenses makes QAR 18,000 net profit, a net margin of 22.5%.
Record expenses in categories every week, not at month end, or your profit and loss will always be incomplete.
A 20-minute weekly reporting routine
- Compare this week's net sales and order count with the previous four weeks.
- Check the average ticket and note what moved it.
- Review your top 10 and bottom 10 products.
- Check discounts, refunds and voids, by promo code and by employee.
- Review cash over/short for every shift.
- Follow up unpaid customer balances older than a week.
- If you have several branches, compare them side by side.
- Write down one decision, and check its result next week.
The last step matters most. A report you read but never act on is just entertainment.
Common reporting mistakes to avoid
- Comparing with yesterday: compare with the same weekday, or the same week last month, to remove normal weekly swings.
- Reading gross instead of net sales: net sales, after discounts and refunds, is the figure that pays the bills.
- Ignoring unpaid orders: a strong sales day with half of it unpaid is not a strong cash day.
- Mixing branches: a combined total can hide one branch that is struggling. Look at each branch, then at the total.
How Quip POS reports work
Quip POS keeps the numbers in one place, so the routine above takes minutes rather than an evening with spreadsheets.
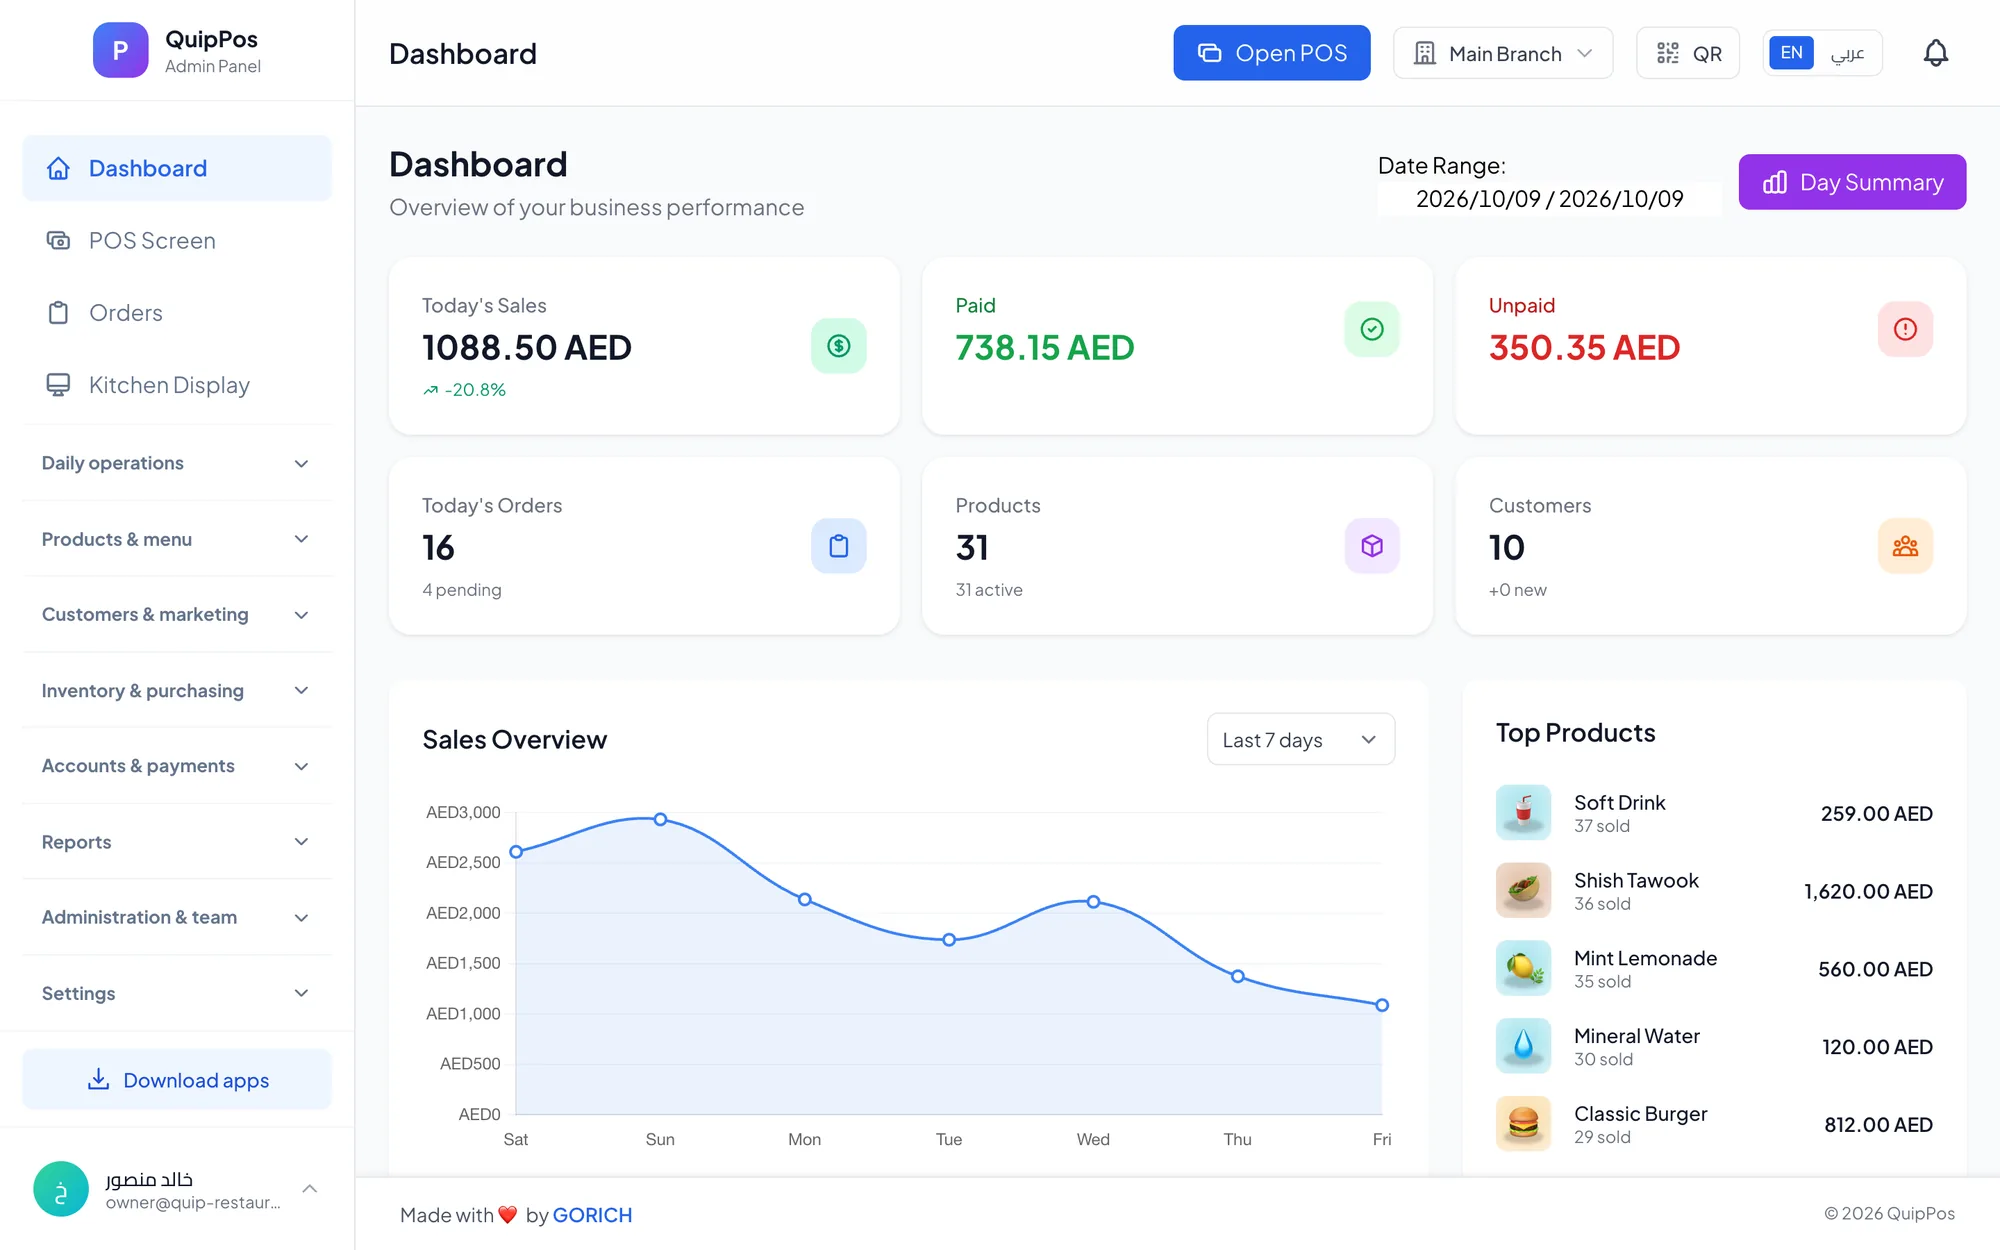
- Live dashboard: today's sales, paid and unpaid amounts and best sellers.
- Reports: sales, products, customers, discounts, tax, cash, cash flow, and profit and loss.
- Shifts: every shift closes with a cash count and an over/short report.
- Costs and margins: restaurant recipes link each item to its ingredients, so every dish shows its cost and margin; categorised expenses, bank accounts and receivables complete the financial picture.
- Team and customers: salons get a commission report per staff member, the loyalty program has its own reports, and the audit log records every sensitive action.
- Branches and export: combined reports for the owner across branches, and report export to Excel for your accountant.
Because the data lives in the cloud, you can check the numbers from any web browser, wherever you are. Explore the reports in a ready company in the live demo, or see the full list on the features page.
Next step: choose your five numbers
Pick the five daily numbers above, set a fixed time to check them, and write down what you will do when each one moves. To see how this works with real reports and your own products, start a 14-day free trial with every feature and no card required.
Frequently asked questions
What reports should a POS system have?
What KPIs should a small business track every day?
How do you calculate average ticket?
What is the difference between sales and profit in POS reports?
How often should I check my POS reports?
Can I export POS reports to Excel?
Talk to the Quip POS team
Tell us about your business and we will show you the right setup, help you add your products and connect your printers.
Related articles
 Management & finance
Cash and Shift Management: Close the Day Without Shortages
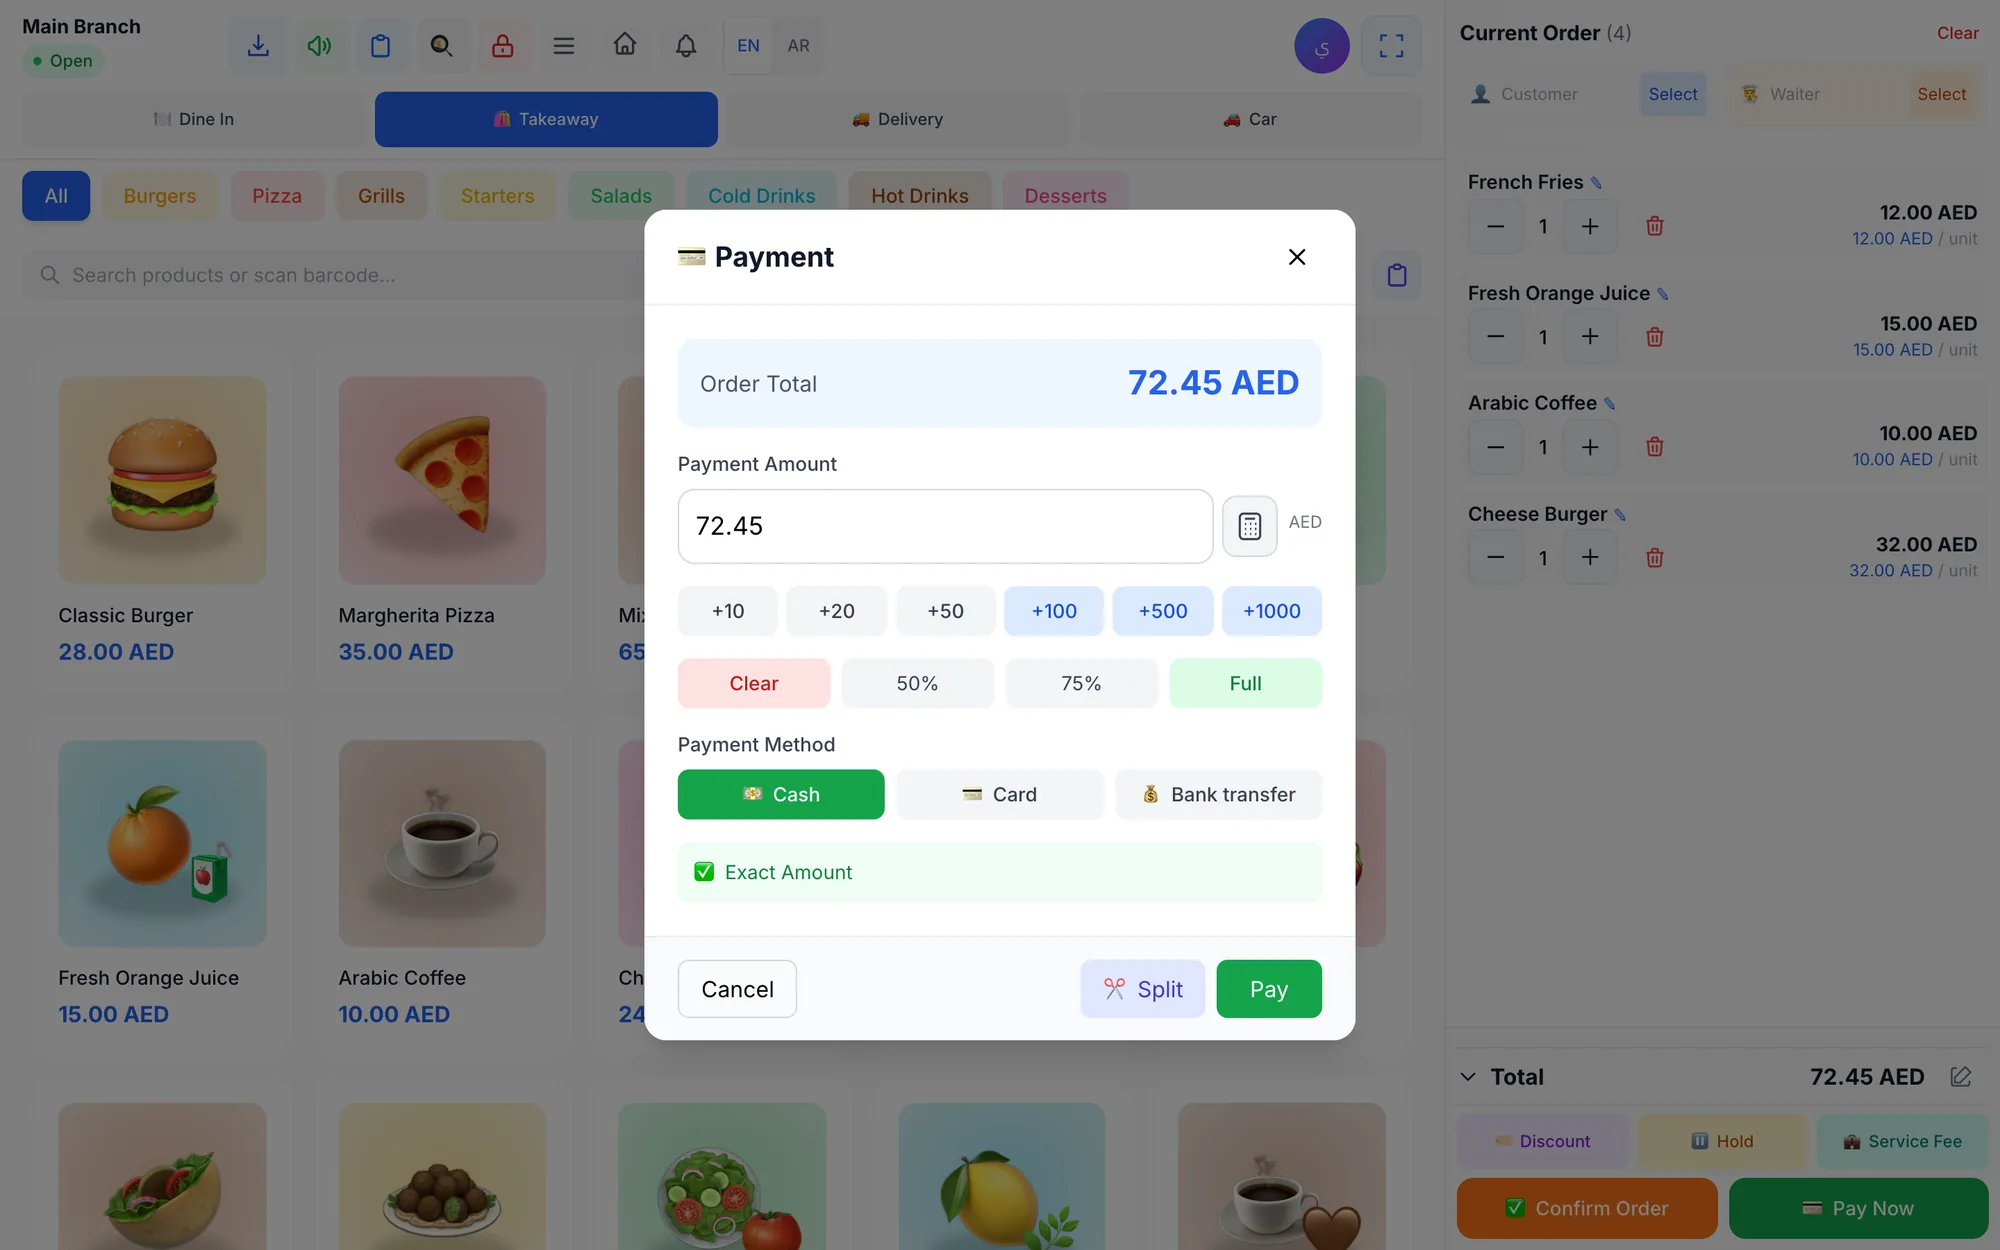
How to open and close POS shifts, count cash, read the over/short report and keep mixed payments and unpaid orders under control, with an end of day checklist.
 Management & finance
Multi-Branch Management: How to Run Every Location From One POS
What to centralise and what to leave to each branch, how to control stock, staff and cash across locations, and how to open a new branch without starting from scratch.
Management & finance
Employee Theft at the POS: How to Reduce Fraud and Cashier Mistakes
The common types of cashier theft and POS fraud, the controls that stop them, the warning signs in your reports and how to investigate fairly.